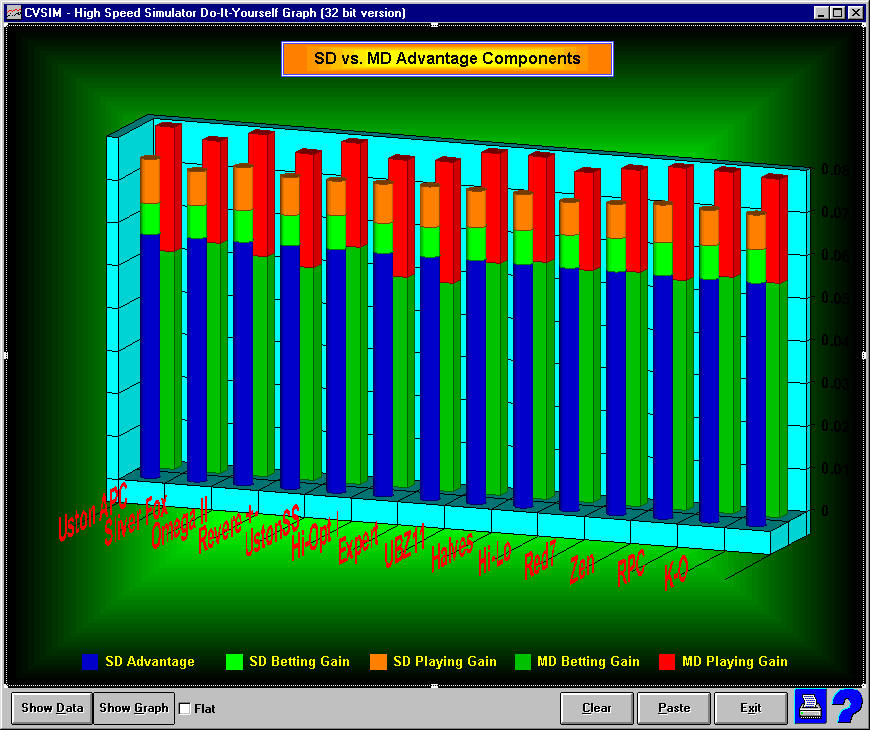
Components of Blackjack Advantage
This chart provides two rows of Stacked Bars.
There are 14 pairs of bars representing the advantages that can be gained
using various card counting strategies according to calculation techniques
described by Peter Griffin in Theory of Blackjack. The y-axis (advantage)
is not quantified as it is relative. The rectangular columns in the back
row indicate the relative gains when playing multi-deck. The dark green
signifies gain from betting and the red indicates gain from using indexes.
A 1-8 spread is assumed. The circular columns in the front row indicate
the relative gains when playing single deck. A 1-2 spread is assumed.
Here, three components are displayed. Again, betting and playing gain
are shown. The, additional, blue segment indicates the gain from playing
SD vs. MD.
So, what does this chart illustrate? Nothing new; but a few concepts
that should be kept in mind:
- Playing gain is equal to or more important than betting gain in
SD as opposed to MD where betting gain is substantially more important.
However, both are important in MD.
- Betting spread can make up for the loss in MD advantage, or for
the pessimist, spread is necessary to make up for the loss in MD advantage.
- The differences between systems are dwarfed by the difference in
spread. That is, we spend altogether too much time thinking and debating
about which system is best and not enough time talking about how to
maximize the spread without getting tossed. This is the simple point
of the chart.
Disclaimers: No simulations were run. Results are calculated from
Griffin formulae. Side counts, number of indexes and cover plays are ignored.
PE calculation is questionable for unbalanced counts.
Return to Blackjack Card Counting
Studies Page
|


