Time Spent in Advantage Situations in Balanced
vs. Unbalanced Blackjack Strategies
Comparing the percentage of time that two Blackjack systems indicate
specified advantages is problematic because the counts are not continuous.
Different systems result in different levels of advantage percentage.
However, I took a shot at it:
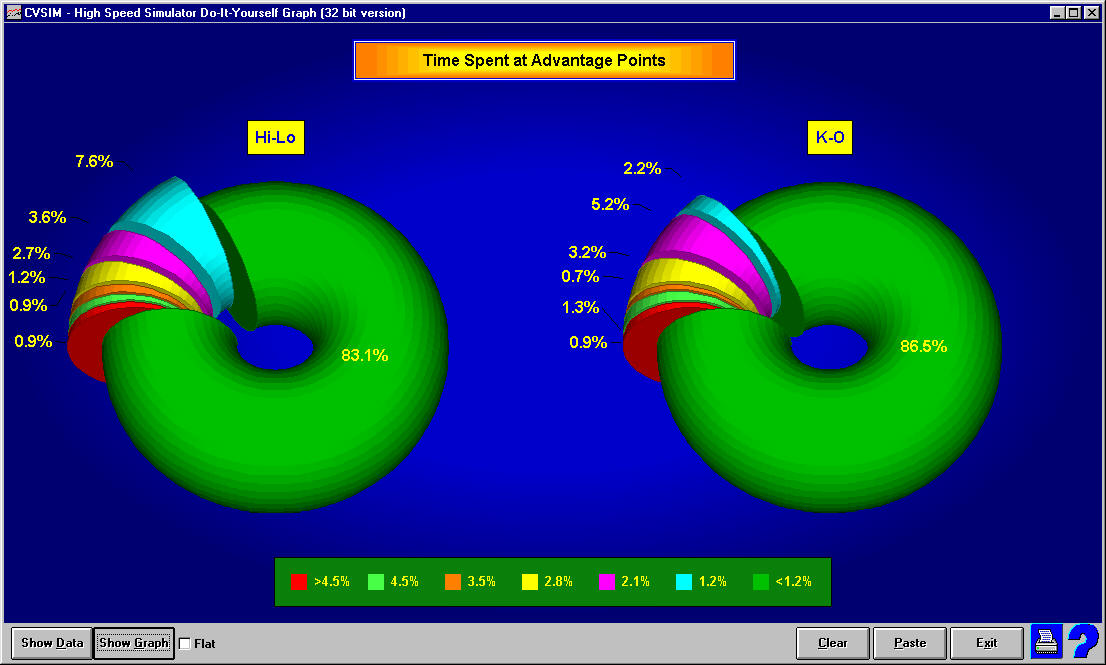
The first chart displays
the time spent at certain advantages for KO Blackjack and Hi-Lo.
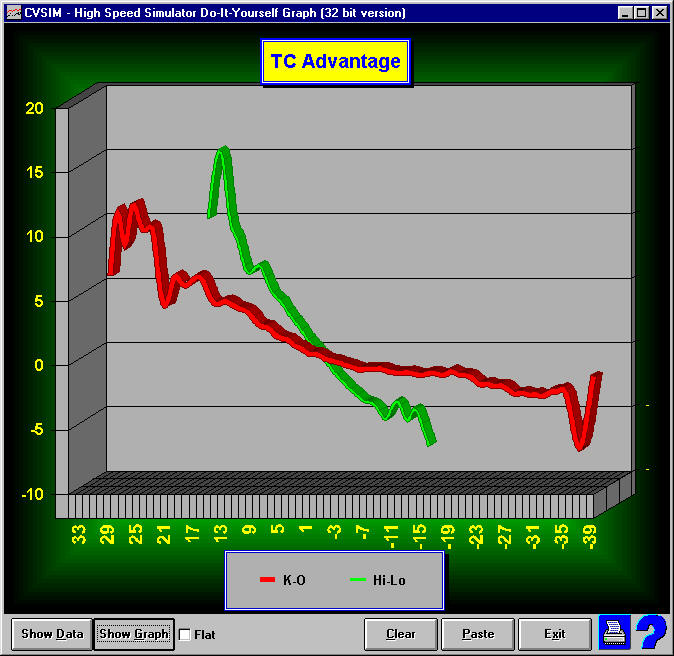
The second chart shows
the advantage at each count (Running Count for KO and True Count for
Hi-Lo.)
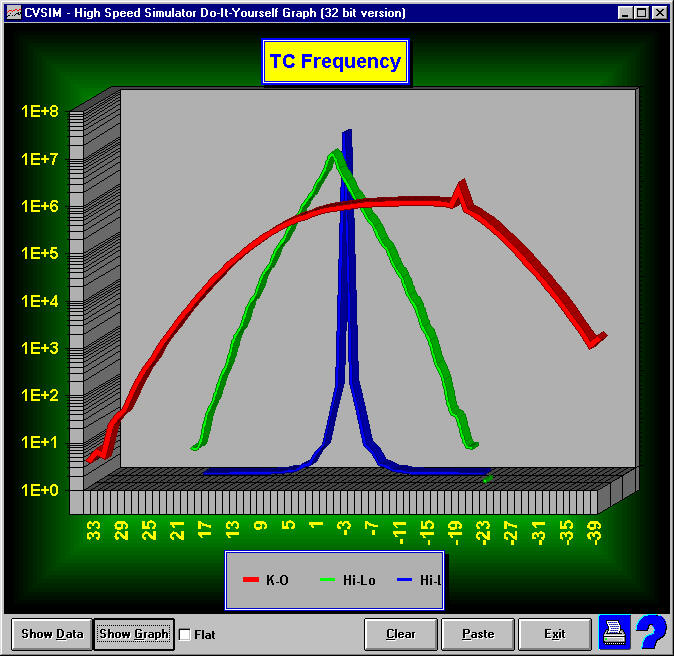
The third chart shows
the frequency of hands at each count. Here, the red and green are charted
using a logarithmic scale. The blue ribbon in the back is the same data
as the green ribbon plotted with a standard scale. It is there to show
why I had to use a logarithmic scale and to show the huge number of hands
at a TC of zero in a system that truncates instead of rounds.
Return to Blackjack Card Counting
Studies Page
| 

