Cumulative Effect of Cover Proscriptions
Thought I'd share some new charts showing one of the affects of cover
betting. In these charts, I am assuming a simple betting scheme of 1,
2, 4, 8, 16 units at True Counts of 1, 2, 3, 4, 5. I start with no cover
and then add one typical cover betting rule at a time. The charts only
show the number of max bets (16 units) made at each True Count.
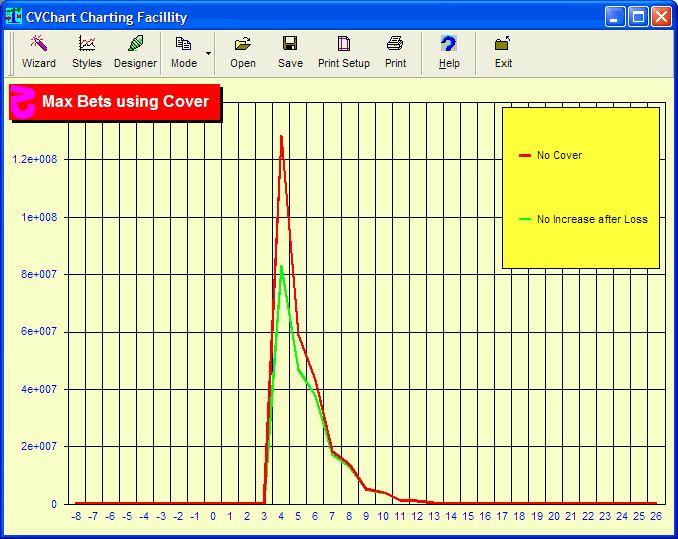
We start below with a chart that shows no cover in red and no bet increases
after a loss in green. The red line shows that there are zero max bets
below TC +4. At TCs +5 and higher there are fewer and fewer max bets because
there are fewer hands at higher TCs. The green line also shows zero max
bets below TC +4. But, a much smaller number of max bets are made at TC
+4 since the player is not increasing the bet after a loss even if the
TC increases. There are fewer max bets at higher TCs also, but the red
and green line grow closer since the TC is less likely to make large increases.
The cost in this instance is not betting enough when the count is high.
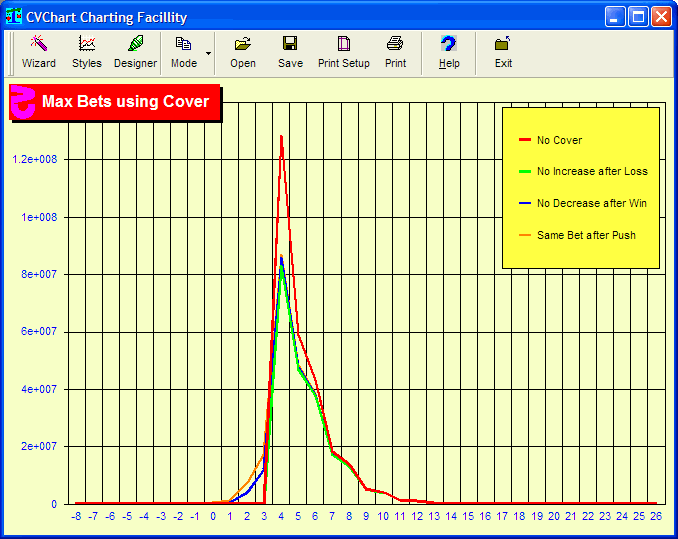
In the second chart, I add the 'no decrease after win' rule. This is
the blue line. At TCs +4 and above, we see about the same number of bets
as not using this rule. But, now we see that max bets are being made at
TCs +2 and +3. That is, we are sometimes overbetting at these counts.

Now let's add the 'same bet after push' rule. The orange line in the
chart below shows even more overbetting at TCs +2 and +3. And a slight
number of max bets even at TC +1. This further reduces SCORE.
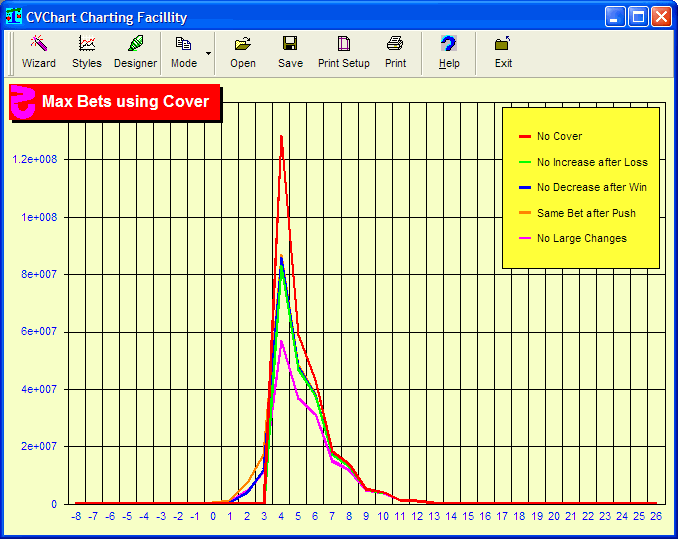
OK, let's add the 'no large bet changes' rule. This is the violet line
below. Here we show a sharper decline in max bets at TC +4. And, to a
lesser degree, further decreases in max bets at TCs +5 and above.
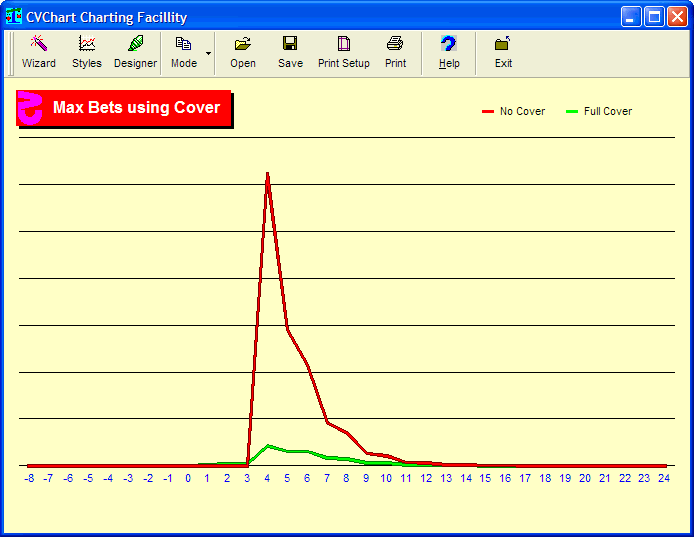
The below summary chart simply shows no cover versus all these cover
rules. Here we clearly see the great reduction of max bets at TCs +4 and
above as well as the overbetting at TCs +3 and below.
One more chart to show why I have included such a wide range of counts.
This is the same as the above chart except it has a logarithmic scale.
What this chart shows is that there are max bets even at TC -8, albeit
small enough that they can't be seen without a logarithmic scale. That
is assuming you haven't left the table.
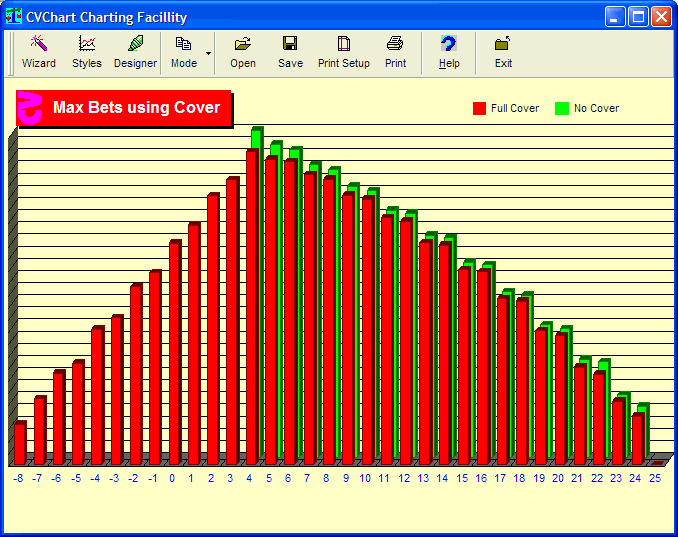
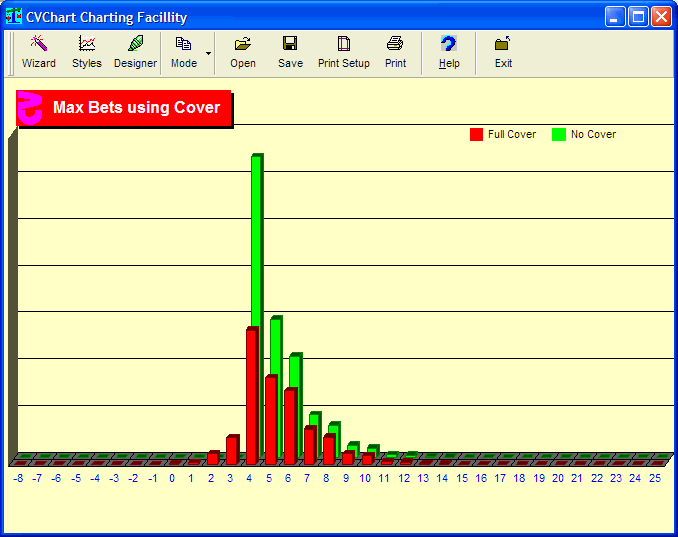
One last chart. All of the sims in the above charts were heads-up against
the dealer. When playing with many players, the count is far more volatile
round to round. The below chart shows the difference between no cover
and full cover at a table with seven players.
Clearly, religious adherence to full cover at a full table is not practical.
|