Ø Many charts display the results at many penetrations as can be seen in the sample chart below. 130-26 along the horizontal axis means that all penetrations have been calculated for 130 through 26 cards behind the cut-card. For each data point, the optimal betting ramp (best way of betting for that exact set of conditions) is calculated for that penetration, and then the SCORE. So, the amounts bet are different. However, the bet spread (your maximum bet divided by your minimum bet) for each point is the same, allowing a fair comparison. More on this later. What we see in the chart below are the SCOREs for REKO under one set of conditions for penetrations from 2.5 decks to 0.5 decks cut off.
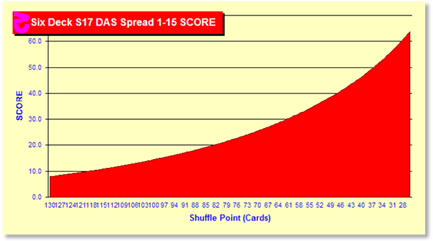
www.qfit.com/book/z3006chart.gif
REKO, FELT Performance
Now we can compare strategies. On the next pages, you will find the performance charts for FELT and REKO promised in earlier chapters. They will be compared with Hi-Lo. Hi-Lo is a very popular, balanced strategy often used as a standard in simulations to compare other strategies. I charted three strategies:
Ø REKO
Ø FELT with 14 compromise indexes
Ø The standard Hi-Lo strategy using the 16 popular indexes
© 2009 Norman Wattenberger