Advantage Bubble Chart
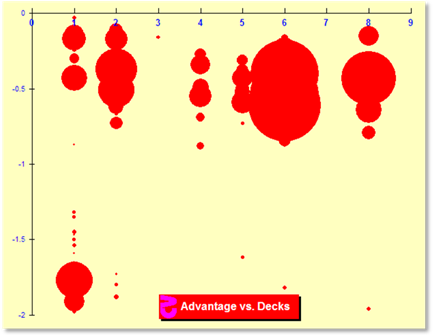
One quite different chart is provided here. This is a bubble chart of basic strategy advantage versus the number of decks. The x-axis is the number of decks from one to eight. The y-axis is the advantage from 0 to -2%. The size of the circles is based on the number of tables that exist. For example, there are 1,015 six-deck tables with an advantage of -.61% Therefore a very large circle is placed in the six-deck column for -.61%. All tables in the U.S. are placed in circles on the chart in this manner.
What we see is a very large number of tables concentrated in the six-deck column with advantages of -.3% to -.62%. In the single-deck column, we see a large concentration at the lower left indicating a very poor advantage. These are the 6:5 Blackjack tables. There are some dots above and below these games since the other rules vary. The 3:2 Blackjack single-deck games are in the upper left with far better advantages. We also see a few very poor games with more decks. Most of these are also 6:5 Blackjack. A few promotional games with positive edge were removed.
www.qfit.com/book/z4010chart.gif
© 2009 Norman Wattenberger