Variance and Volatility Data
What are long and short runs?
Volatility is our worst enemy. On the other hand, if we merely won exactly 1% of every hand we played, we would have the most boring job in existence, and, we would never be allowed to play.
 There are four charts in this topic displaying results
starting with the short term (1,000 hands) and moving through successively
longer terms (up to a million hands). We start with a chart displaying the amount
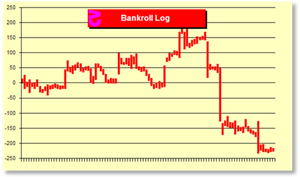
won or lost for a card counter playing 1,000 hands. The 1,000 hands are
displayed in 100 groups of ten hands each. Each group of ten hands is a
vertical line showing the minimum and maximum overall result from the start of
the chart during those ten hands. So the last bar in the chart shows that in
hands 991 through 1,000, our results varied between -220 to -226 units. We can
see a few large swings denoted by the long vertical lines. This is not a
surprise. Most of the time we make small bets. But when the count rises, we can
make several max bets and experience a large swing. This chart shows these
occasional large swings and the fact that we can easily end up behind in 1,000
hands.
There are four charts in this topic displaying results
starting with the short term (1,000 hands) and moving through successively
longer terms (up to a million hands). We start with a chart displaying the amount
won or lost for a card counter playing 1,000 hands. The 1,000 hands are
displayed in 100 groups of ten hands each. Each group of ten hands is a
vertical line showing the minimum and maximum overall result from the start of
the chart during those ten hands. So the last bar in the chart shows that in
hands 991 through 1,000, our results varied between -220 to -226 units. We can
see a few large swings denoted by the long vertical lines. This is not a
surprise. Most of the time we make small bets. But when the count rises, we can
make several max bets and experience a large swing. This chart shows these
occasional large swings and the fact that we can easily end up behind in 1,000
hands.
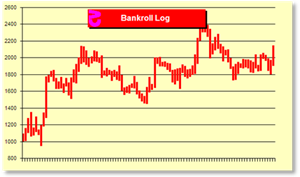 Now we move to 10,000 hands in groups of 100. The y-axis has
been expanded to a larger range. We see some very large swings. The tenth line
shows a range from about 1,300 to 1,800 units in 100 hands. At some point in
those 100
Now we move to 10,000 hands in groups of 100. The y-axis has
been expanded to a larger range. We see some very large swings. The tenth line
shows a range from about 1,300 to 1,800 units in 100 hands. At some point in
those 100
© 2009 Norman Wattenberger