What is that hump in the single-deck charts?
 Throughout this book, you will find many SCORE charts by penetration.
Normally, the curves swing dramatically upwards as the penetration increases,
since we enjoy better results at deeper penetrations. The exception is
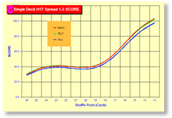
single-deck charts, where we see a dip in the middle of the chart like that at
the right. So, what is this dip?
Throughout this book, you will find many SCORE charts by penetration.
Normally, the curves swing dramatically upwards as the penetration increases,
since we enjoy better results at deeper penetrations. The exception is
single-deck charts, where we see a dip in the middle of the chart like that at
the right. So, what is this dip?
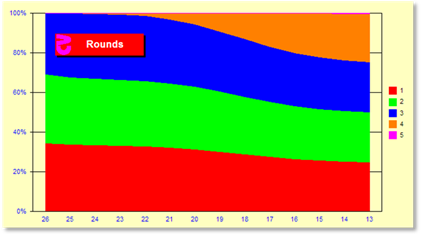
Below we see a stacked, percentage chart of the rounds in a three-player, single-deck game. For example, at the far left, we see the percentages of rounds that are rounds number 1, 2, and 3. The red, green and blue areas show about 33% of all rounds are round numbers 1, 2, and 3. So far, so good. Now let us increase the penetration as we move to the right in the chart. We start to see an orange area appear indicating some percentage of the rounds are a fourth round. At the far left, about 25% of the rounds are round numbers 1, 2, 3, and 4. Great. We have an extra round, deeper in the deck, and that improves SCORE. But, look at penetrations of 20-23. Only a small percentage of rounds are round 4. Due to the cut- card effect, these will likely be lousy rounds. They will only occur when the previous rounds contained many tens and will usually have a negative count. Therefore, they will drag down results. Hence the dip in the curve.
www.qfit.com/book/z4170Chart.gif
© 2009 Norman Wattenberger