Blackjack Cut Card Effect
Thought Id put together some charts to illustrate the Cut-Card Effect.
I created four charts from 2.6 billion single-deck, basic strategy hands.
About half of the hands were fixed at eight rounds per deck and the other
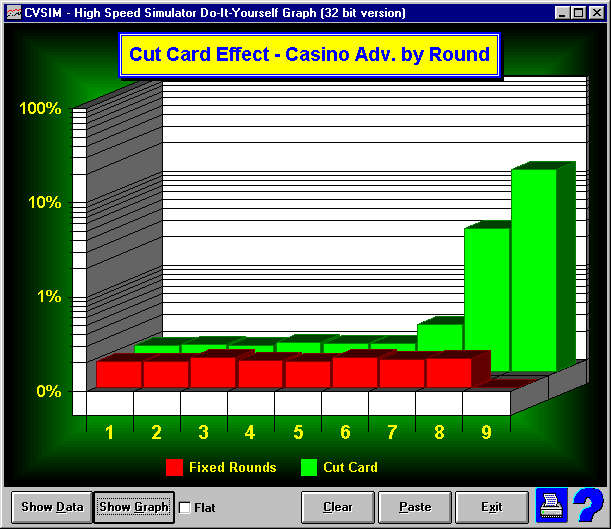
half dealt to a 75% penetration (6 to 9 rounds.) The first simple
chart shows the advantage by hand depth. The red bars show a even
0.2% advantage for the casino for all hand depths when dealing a fixed
number of rounds. The green bars show the enormous increase in the casinos
advantage in the late rounds when dealing with a cut card. The advantage
is so great, that I had to use a logarithmic scale (0.2% to 14%). Fortunately,
there are not many hands dealt at the 14% casino advantage.
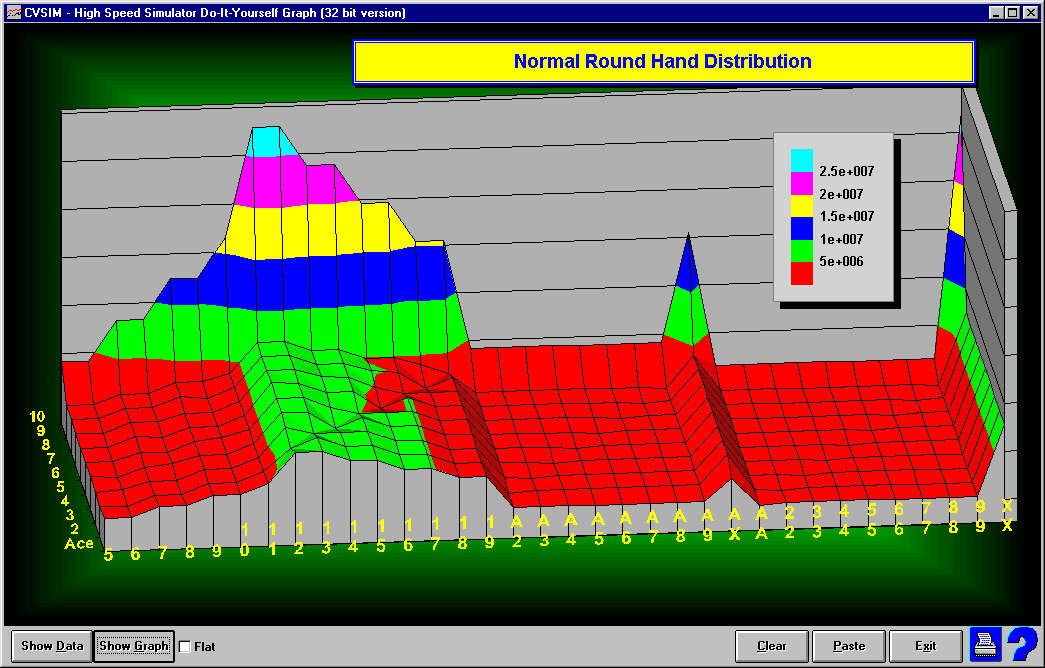
The following three charts each show hand dealt quantities. Each chart
has as its x-axis, all possible first two card player combinations. The
y-axis shows the dealer up-card. The z-axis shows the number of incidents
of each of the first two player cards vs. dealer up card..
Chart I: The first chart
shows the normal distribution of Blackjack hand types. That is, the number
of times that you will receive each of the possible first two cards against
each dealer up card.
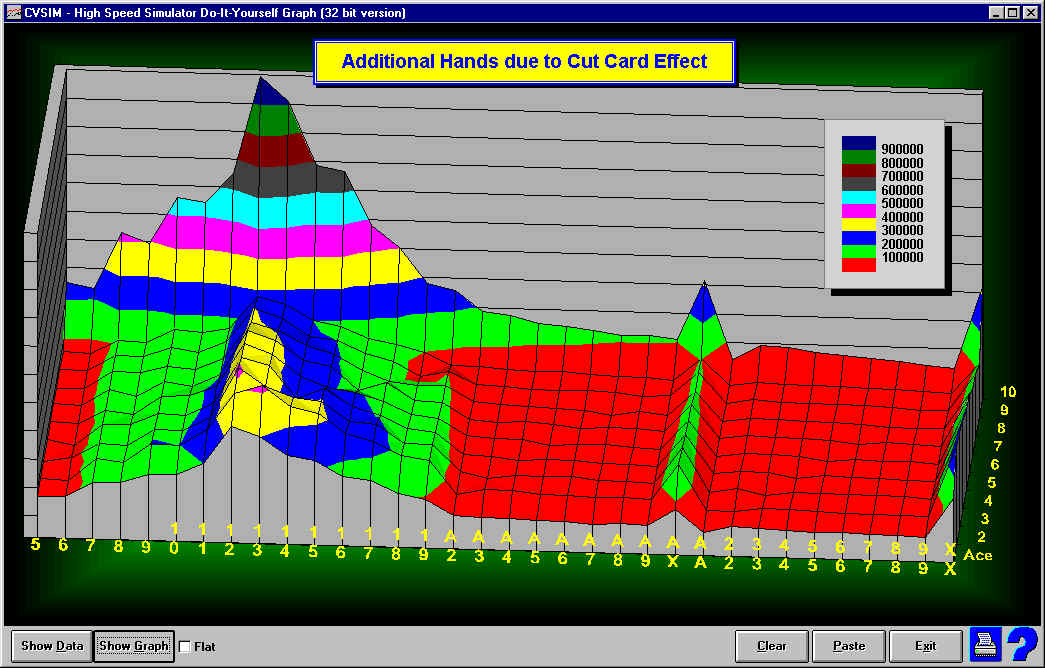
Chart II: The second chart
shows the distribution of hand types in the last rounds when playing with
a cut card. In this chart, there exist more low cards since it is much
more likely that you will see additional rounds when large cards are dealt
in the earlier rounds.
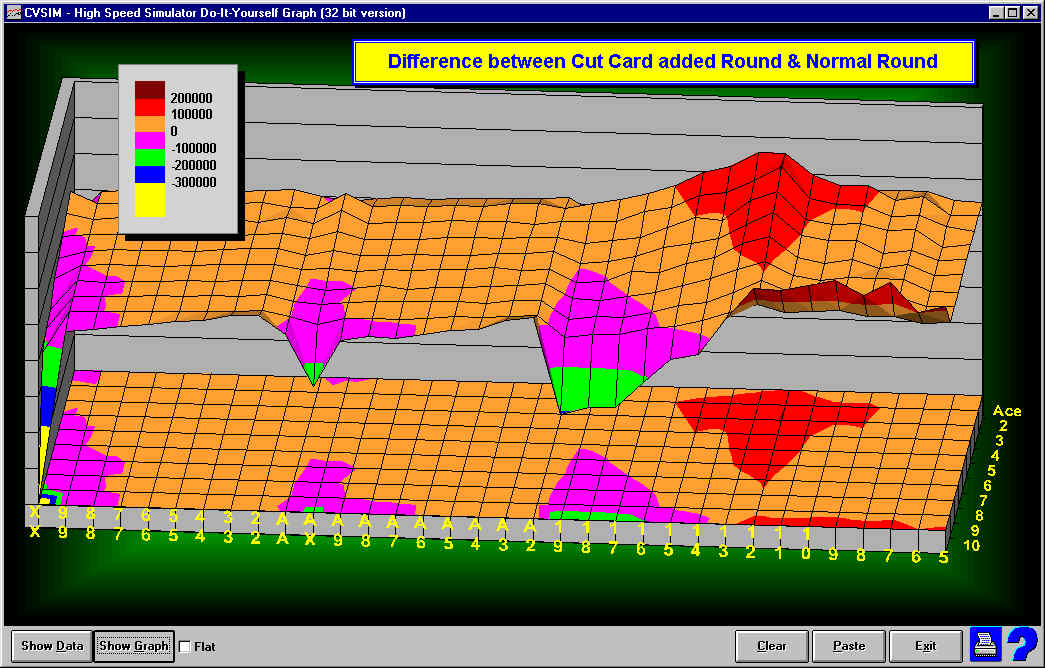
Chart III: This is essentially
the difference between the two previous charts. It shows the delta between
the normal distribution of hands and the distribution of hands in the
late rounds when using a cut card. This is a surface area chart with a
projection of the colors to the base to more easily see the problem areas.
Red and orange areas show the types of hands more likely to be seen in
the late rounds. The chart shows a substantial increase in stiffs, particularly
against dealer low cards. Also, more low hands (5-12) against a dealer
ten. There is a corresponding decrease in Blackjacks, twenties, and 17-19
hands against good dealer up cards.
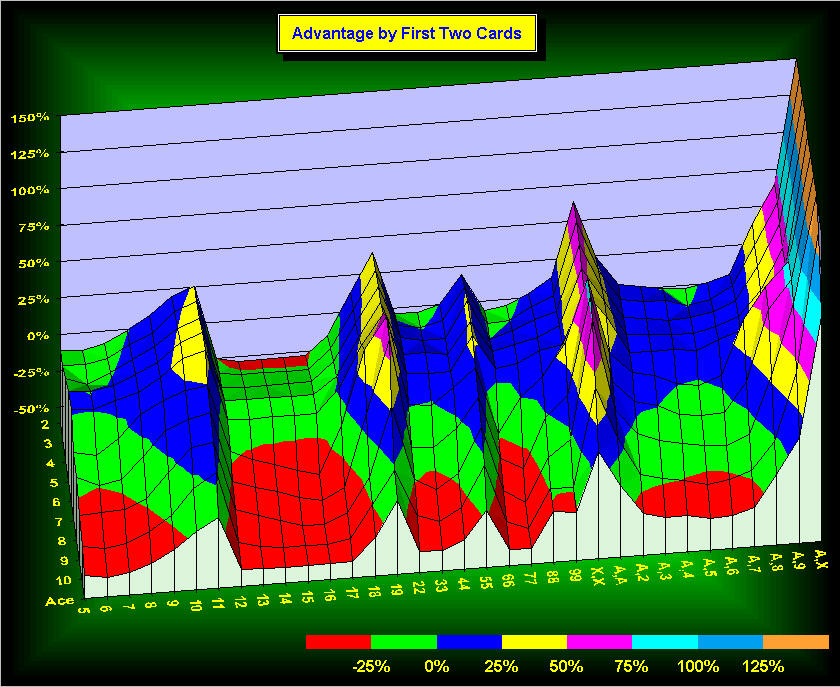
I also have an old chart
which shows the advantage at each of the above hand types. It can be seen
that most of the hands where we have seen increases due to the cut-card
effect are poor advantage hands.
Of course, all that Ive shown with all of the above is what was already
known. The cut card adds hands when the deck is lean in tens. So, does
this mean that you should avoid SD dealt to a fixed penetration. Yes,
if youre playing BS. But, if youre counting, its not so clear. Ive
just started working on those charts, and it appears that counting overcomes
the effect even in the late rounds. At least at the depths at which Im
currently testing.
Return to Blackjack Card Counting
Studies Page
| 

