
 CVCX Charts
CVCX Charts
CVCX Charts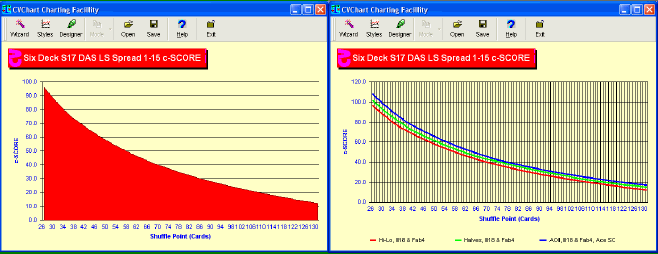
A picture is worth a thousand words. Numerous charts can be generated
by CVCX using the simulation data, your parameters and the calculators. 23 different
types of charts are supported visually displaying large amounts of data in simple
curves. For example, you can compare four different strategies at every penetration
point in one chart. That's 420 sims in one chart giving you the ability
to examine weak points in a strategy.