Progression system over time
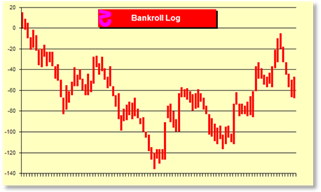 I have added a set of charts here to give a better idea of
the concepts of long and short terms. There are four charts on two pages
displaying results starting with the short term (1,000 hands) and moving
through successively longer terms (up to one million hands). The 1,000 hands in
this chart are displayed in 100 groups of ten hands each. Each group of ten
hands is a vertical line showing the minimum and maximum overall result from
the start of the chart during those ten hands. What we see is fairly random
movement. We win at first, then generally move down and after a while nearly
make it back to even after about 900 hands.
I have added a set of charts here to give a better idea of
the concepts of long and short terms. There are four charts on two pages
displaying results starting with the short term (1,000 hands) and moving
through successively longer terms (up to one million hands). The 1,000 hands in
this chart are displayed in 100 groups of ten hands each. Each group of ten
hands is a vertical line showing the minimum and maximum overall result from
the start of the chart during those ten hands. What we see is fairly random
movement. We win at first, then generally move down and after a while nearly
make it back to even after about 900 hands.
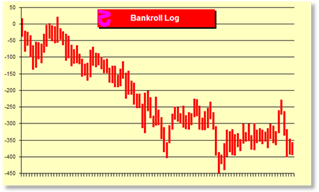
Next, we move to 10,000 hands in groups of 100. Here we see that the player actually made his money back and turned a profit after 1,400 hands, but then started a downward fall.
Charts at www.qfit.com/Book/z610Chart.gif through z611Chart.gif
© 2009 Norman Wattenberger