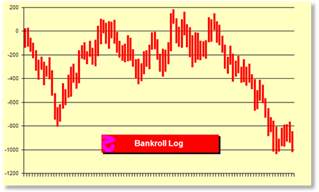
 Let's expand this to 100,000 hands in groups of 1,000. We see
the y-axis has expanded as our results in this section range from 1,000 units
behind to 200 units ahead. Here we see that after 28,000 hands the player is
ahead again. And again, after 50,000 hands the player is ahead a couple of more
times. After this, we fall quite a bit behind.
Let's expand this to 100,000 hands in groups of 1,000. We see
the y-axis has expanded as our results in this section range from 1,000 units
behind to 200 units ahead. Here we see that after 28,000 hands the player is
ahead again. And again, after 50,000 hands the player is ahead a couple of more
times. After this, we fall quite a bit behind.
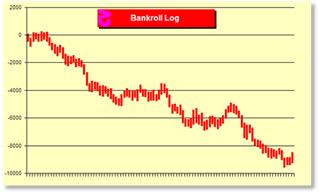 Finally, one million hands in groups of 10,000. Here we start
to see the long run. We start at zero units won and after several points where
we turned a profit, we end up losing 9,000 units. The line is smoother as we
are looking at more hands, but we still see periods of increasing bankroll at
this resolution. If this were expanded to 100,000,000 hands, you would see a
nearly straight downward slope. Normal standard deviation allows just about
anything to happen in the short term and a Basic Strategy players results
would not look much different.
Finally, one million hands in groups of 10,000. Here we start
to see the long run. We start at zero units won and after several points where
we turned a profit, we end up losing 9,000 units. The line is smoother as we
are looking at more hands, but we still see periods of increasing bankroll at
this resolution. If this were expanded to 100,000,000 hands, you would see a
nearly straight downward slope. Normal standard deviation allows just about
anything to happen in the short term and a Basic Strategy players results
would not look much different.
Of course, this is just one run. Other runs will see the swings at different points and of different sizes. Some groups of 50,000 hands will win and some will lose. But the house edge is still the same as flat betting. At any specific number of hands, the average expected loss will be the house edge times the number of dollars bet. Unlike the card counters results, the trend is down.
© 2009 Norman Wattenberger