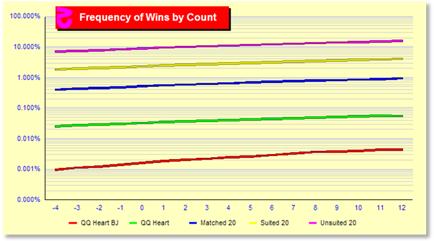
How often do I win each payoff?
This chart and table show the frequency of wins for the five different payouts by true count. The y-axis uses a logarithmic scale because the differences in frequencies are so large. All payouts increase in frequency as the count increases. These percentages include the cut-card effect.
|
|
QQ ♥ & BJ |
QQ ♥ |
Matched 20 |
Suited 20 |
Unsuited 20 |
|
-4 |
0.001% |
0.026% |
0.399% |
1.826% |
7.015% |
|
-3 |
0.001% |
0.027% |
0.424% |
1.933% |
7.433% |
|
-2 |
0.001% |
0.029% |
0.452% |
2.044% |
7.861% |
|
-1 |
0.001% |
0.031% |
0.479% |
2.157% |
8.311% |
|
0 |
0.002% |
0.033% |
0.517% |
2.318% |
8.940% |
|
1 |
0.002% |
0.035% |
0.557% |
2.483% |
9.587% |
|
2 |
0.002% |
0.037% |
0.585% |
2.605% |
10.065% |
|
3 |
0.002% |
0.039% |
0.617% |
2.737% |
10.574% |
|
4 |
0.002% |
0.041% |
0.648% |
2.865% |
11.086% |
|
5 |
0.003% |
0.043% |
0.682% |
3.004% |
11.633% |
|
6 |
0.003% |
0.045% |
0.716% |
3.151% |
12.188% |
|
7 |
0.003% |
0.047% |
0.750% |
3.293% |
12.761% |
|
8 |
0.004% |
0.049% |
0.789% |
3.443% |
13.360% |
|
9 |
0.004% |
0.051% |
0.822% |
3.582% |
13.921% |
|
10 |
0.004% |
0.053% |
0.861% |
3.753% |
14.558% |
|
11 |
0.004% |
0.056% |
0.886% |
3.871% |
15.053% |
|
12 |
0.004% |
0.055% |
0.943% |
4.054% |
15.705% |
www.qfit.com/Book/z242Chart.gif
© 2009 Norman Wattenberger